Bion App
Bion is a Rust-based application developed as part of a thesis project focused on bioreactor modeling using Runge-Kutta and Nelder-Mead methods.
Getting the App
Instalation
Downloading the binary
Bion can be installed by downloading a release binary from the release.
Building from source
Alternatively you can build the package from source by downloading the git repository and building it
git clone https://github.com/Tiggax/bion.git
cd bion
cargo build --release
There is also a Nix flake present for better dependency managment.
Usage
To see the code documentation see the Docs
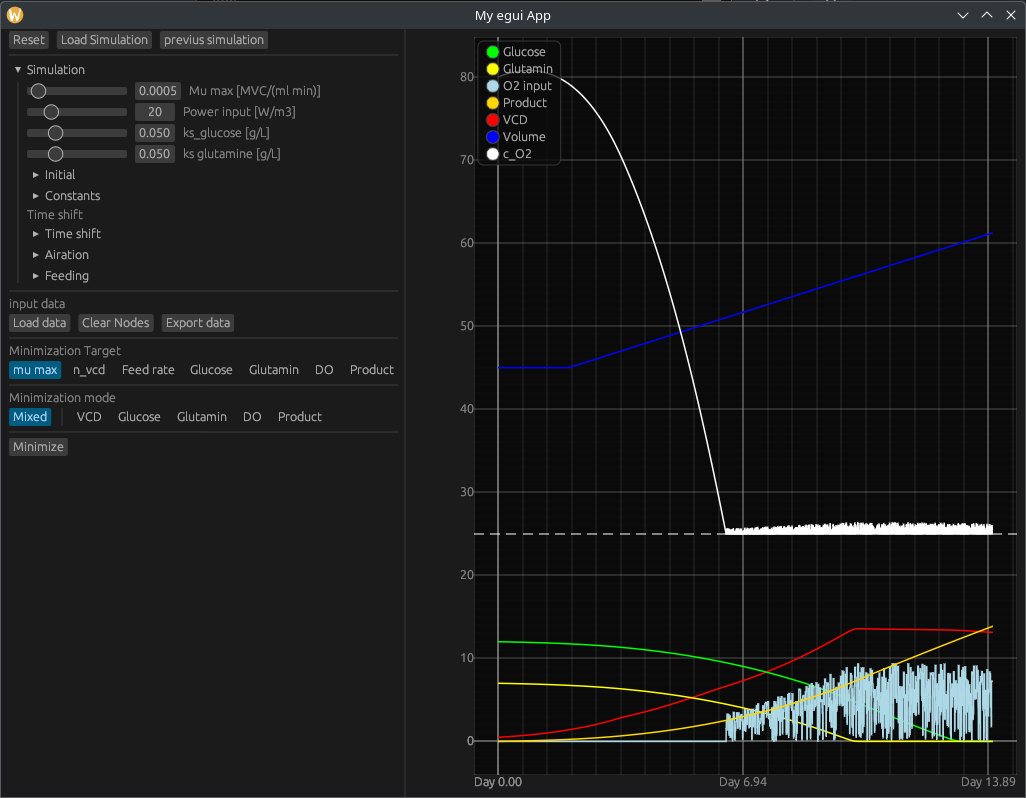
The app is divided into two sections.
-
the control panel on the left with:
-
Simulation tab
-
Data tab
-
Minimization tab
-
-
the graph of the simulation on the right
Control panel
Control panel is the left panel of the software. It contains all of the controls of the sofware.
It has a Menu bar and content devided into three sections:
- Simulation parameters tab with all of the general simulation controls.
- Data tab with data import/export functionalities
- Minimization section with all of the minimization controls
Menu bar
menu bar contains the following controls:
Reset
That resets the simulation parameters
Load Simulation
Loads a simulation from <file>.json state file
Previuous Simulation
Go to the previous simulation state
Simulation parameters tab
This section contains all of the model parameters. Changing any of the parameters updates the model accordingly. The constants and variables of the model are devided into subsections to classify them further.
-
Mu Max [MVC / (mL min)]:
-
Power input [W/m^3]:
-
KS glucose [g/L]:
-
KS glutamine [g/L]:
-
Initial
- VCD [MVC/mL]:
- Volume [L]:
- Glucose [g/L]:
- Glutamine [g/L]:
- Oxigen part [%]:
-
Constants
- Product [mg/(MVC min)]:
- Glucose [mg/(MVC min)]:
- Glutamine [mg/(MVC min)]:
- k DO [mol/L]:
- k P [/]:
- Henry's constant [mol/(bar L)]:
-
Time shift
- Time shift
- shift day [day]:
- post shift growth [%]:
- Airation
- Cell metabolism [mol/(cell min)]:
- Air Flow [L/min]:
- PID
- Minimum [%]:
- Max Flow [L/min]:
- FI Oxygen Max [L/min]:
- Feeding
- Start [day]:
- Rate [%]:
- Glucose [g/L]:
- Glutamine [g/L]:
- Time shift
Data tab
This tab contains three buttons.
Load Data
Loads a csv with data points into the simulation.
The csv must include the following columns:
| minutes | vcd | gln | gluc | do_50 | product |
|---|---|---|---|---|---|
| the ammount of time passed in minutes | Viable cell density | glutamine concentration | glucose concentration | dissolved oxygen | product concentration |
Clear Nodes
This button clears the experimental data nodes from the graph.
Export data
You can use this button to export simulation data.
The program saves a csv file with the data nodes of each of the parameters, with step size of 1 minute.
It also saves a json file with the same name containing all of the simulation parameters.
This file can then be used with Load Simulation to recreate the simulation state.
Minimization
The remaining parts include all of the options and controls retaining to the minimization of the simulation.
Minimization Target
This section contains the target selection of the minimization. The target is the value getting changed and minimized by the function with each iteration. The available choices are:
| mu_max | n_vcd | Feed rate | Glucose | Glutamine | DO | Product |
|---|
Minimization mode
You have a choice of selectin the mode of operation for the minimization function value. Each iteration of the minimization returns a value, that is then read to grade the best minimization. This is done by selecting the simulation values at each experimental nodes position in time, and returning the sum of the difference between the experimental value and the simulation. Selecting the specific mode will only look at values of that parameter, while selecting Mixed will simply look at each one and returning the sum of all differences.
Statistics
When a user imports data, some simple statistics are shown for RMSE and R^2 values. These can be used to quantify simulation fittnes.
Running the minimization
after importing the experimental nodes and selecting your wanted target and mode, you can click the Minimize button and the software will try to minimize the simulation to the experimental data.
The simulation parameters will automatically update to reflect the minimized solution.
Visualization panel
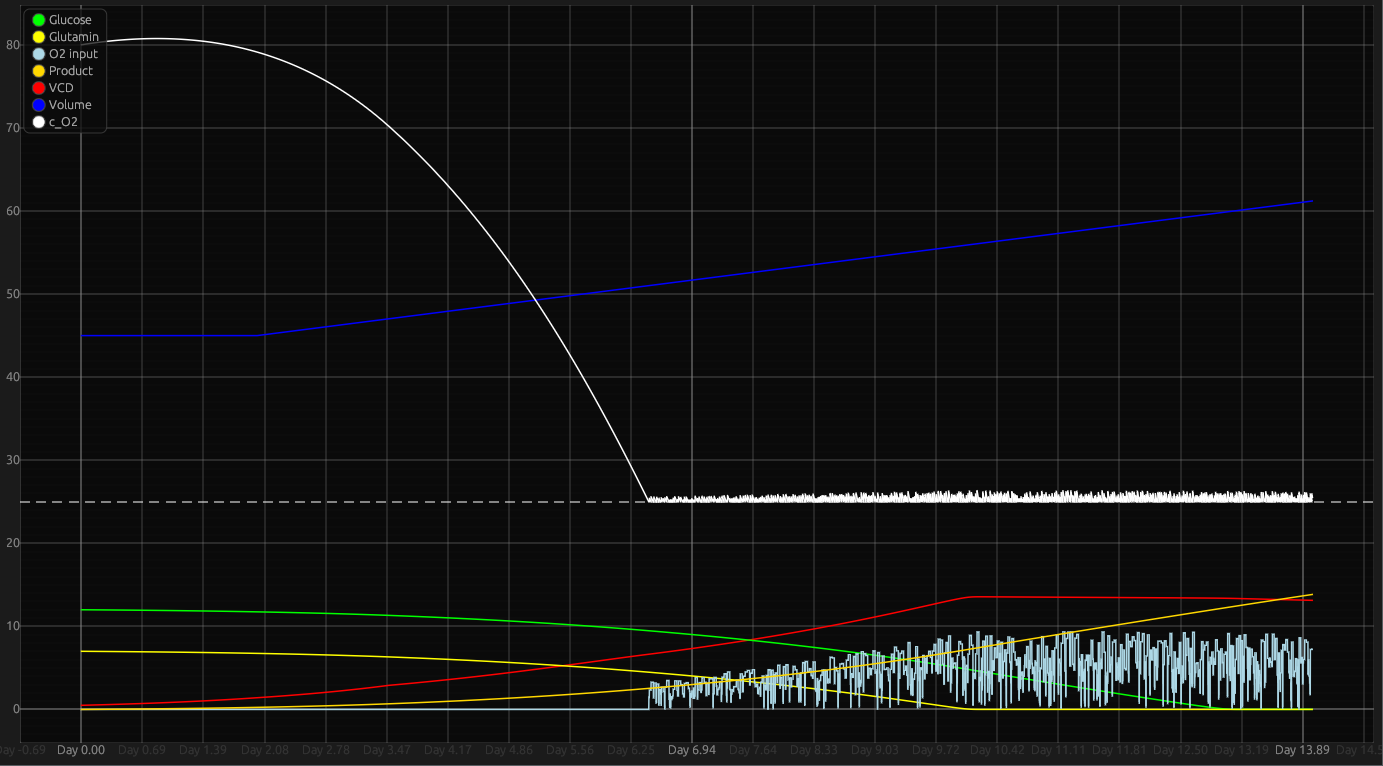
Viewing data
You can view specific data by hovering over the wanted data point.
Navigation
double left clicking resets the plot to the default position.
Moving around the plot
You can move around the graph using scroll-wheel for y axis and shift + scroll-wheel for the x axis.
It should support touch gestures, and trackpad gestures.
Zooming
You are able to zoom in and out by using ctrl + scroll-wheel or by using touch gestures on interfaces that support them.
holding right mouse button and selecting an area, zooms into that area.